Stats: Goodness-of-fit Test
The idea behind the chi-square goodness-of-fit test is to see if the sample comes from the
population with the claimed distribution. Another way of looking at that is to ask if the frequency
distribution fits a specific pattern.
Two values are involved, an observed value, which is the frequency of a category from a sample,
and the expected frequency, which is calculated based upon the claimed distribution. The
derivation of the formula is very similar to that of the variance which was done earlier (chapter 2
or 3).
The idea is that if the observed frequency is really close to the claimed (expected) frequency, then
the square of the deviations will be small. The square of the deviation is divided by the expected
frequency to weight frequencies. A difference of 10 may be very significant if 12 was the
expected frequency, but a difference of 10 isn't very significant at all if the expected frequency
was 1200.
If the sum of these weighted squared deviations is small, the observed frequencies are close to the
expected frequencies and there would be no reason to reject the claim that it came from that
distribution. Only when the sum is large is the a reason to question the distribution. Therefore,
the chi-square goodness-of-fit test is always a right tail test.
 The test statistic has a chi-square distribution when the
following assumptions are met
The test statistic has a chi-square distribution when the
following assumptions are met
- The data are obtained from a random sample
- The expected frequency of each category must be at least 5. This goes back to the
requirement that the data be normally distributed. You're simulating a multinomial experiment
(using a discrete distribution) with the goodness-of-fit test (and a continuous distribution), and
if each expected frequency is at least five then you can use the normal distribution to
approximate (much like the binomial). If the expected
The following are properties of the goodness-of-fit test
- The data are the observed frequencies. This means that there is only one data value for each
category. Therefore, ...
- The degrees of freedom is one less than the number of categories, not one less than the sample
size.
- It is always a right tail test.
- It has a chi-square distribution.
- The value of the test statistic doesn't change if the order of the categories is switched.
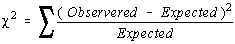
- The test statistic is

Interpreting the Claim
There are four ways you might be given a claim.
- The values occur with equal frequency. Other words for this are "uniform", "no preference",
or "no difference". To find the expected frequencies, total the observed frequencies and divide
by the number of categories. This quotient is the expected frequency for each category.
- Specific proportions or probabilities are given. To find the expected frequencies, multiply the
total of the observed frequencies by the probability for each category.
- The expected frequencies are given to you. In this case, you don't have to do anything.
- A specific distribution is claimed. For example, "The data is normally distributed". To work a
problem like this, you need to group the data and find the frequency for each class. Then, find
the probability of being within that class by converting the scores to z-scores and looking up
the probabilities. Finally, multiply the probabilities by the total observed frequency. (It's not
really as bad as it sounds).
Using the TI-82
You can use the lists on the TI-82 to perform the chi-square goodness-of-fit test.
Table of Contents