 This question wants you to generate a scatterplot and try to determine the
value of the correlation coefficient based on the scatterplot alone.
This question wants you to generate a scatterplot and try to determine the
value of the correlation coefficient based on the scatterplot alone.The worksheet will be provided to you by the instructor. That is so that you won't know whose blood pressure and pulse rate is whose. Although gender and age may be related to blood pressure and pulse rate, we're not collecting that information for this project. If this were a more clinical study, we would collect and analyze that data and more.
The variables recorded are called systolic, diastolic, and pulse.
From now on, when you need to work with the project, open the one for your group.
Some of you are going to be asked to convert torrs into either psi or pascals. Here is how you do that.
This example assumes that you want to convert the systolic blood pressure from torrs into pounds per square inch (psi). If you want to convert diastolic blood pressure, then replace systolic with diastolic every place it occurs in this example. Some of you may need to convert both.
After converting the units, be sure to use the new variable for the rest of the activity.
This example assumes that you want to convert the diastolic blood pressure from torrs into Pascals (Pa). If you want to convert systolic blood pressure, then replace diastolic with systolic every place it occurs in this example. Some of you may need to convert both.
After converting the units, be sure to use the new variable for the rest of the activity.
 This question wants you to generate a scatterplot and try to determine the
value of the correlation coefficient based on the scatterplot alone.
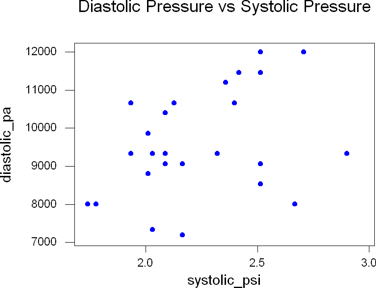
This example assumes that my predictor (x) variable is systolic blood pressure in psi (systolic_psi) and the response (y) variable is diastolic blood pressure in Pascals (diastolic_pa). Be sure you use your variables!
Now make a guess as to what you think the correlation coefficient would be. For my data, there appears to be a very slight positive correlation, but it's not very good at all. I would guess about r = 0.1.
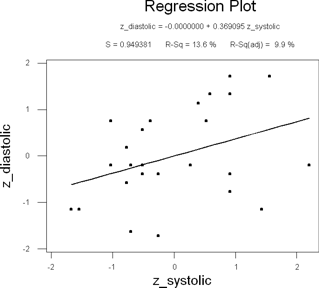
 My variables are diastolic_pa and systolic_psi.
You should use whichever variables you're working with instead of the ones
in my example. The units aren't necessary on the standardized variables because
z-scores don't have units.
There are two ways to find the slope.
The first way is to find the coordinates of a point on the line. By point, I don't mean data points (the dots), I just mean a point somewhere on the line. You may be lucky enough to have a data point on the line that you could figure out the coordinates for, but probably not.
If I take a straightedge and go straight up from the 1 on the x-axis to the line, it looks like the y-value is about 0.4. The best fit line for a standardized plot will always pass through the origin, so now I have two points. From the point (0,0) to the point (1,0.4), my rise is 0.4 and my run is 1. Since slope is rise over run, my slope and correlation coefficient would be about 0.4/1 = 0.4.
The second way is almost cheating, so I hesitate to even mention it. Don't use it for this part of the problem as I want you to get a visual understanding of how correlation and slope are related. The equation of the regression line is given above the graph. In my case, it says "z_diastolic = 0.0000000 + 0.369095 z_systolic". That's the slope-intercept form of a line, so my slope is 0.369095. That's not too far off from the 0.4 that I estimated by using the first method.
I'm going to describe my predictor variable of systolic_psi and my response variable of diastolic_pa. Be sure you use your variables instead of mine.
You should get some output that looks like this.
Variable             N       Mean     Median     TrMean      StDev    SE Mean
systolic            25     2.2407     2.1657     2.2338     0.2993     0.0599
diastoli            25       9605       9333       9605       1395        279

Variable       Minimum    Maximum         Q1         Q3
systolic        1.7403     2.9005     2.0207     2.5138
diastoli          7199      11999       8666      10666
Copy the sample size, mean, and standard deviation onto your activity sheet.
I'm going to find the correlation between my variables of systolic_psi and diastolic_pa. Be sure you use your variables instead of mine.
You will get something that looks like this. The first number is the correlation coefficient. The second number is the p-value.
Pearson correlation of systolic_psi and diastolic_pa = 0.369
P-Value = 0.069
Now, repeat these steps, but put the response variable first and the predictor variable second.
I'm going to describe my predictor variable of systolic_psi and my response variable of diastolic_pa. Be sure you use your variables instead of mine
You will get a lot of information. The part we want for question 12 is just the first line of all that.
The regression equation is
diastolic_pa = 5749 + 1721 systolic_psi
There will be an "Analysis of Variance" table that is generated as part of the regression output from question 12. It looks something like this.
Analysis of Variance


Source            DF          SS          MS         F        P
Regression         1     6365998     6365998      3.63    0.069
Residual Error    23    40363404     1754931
Total             24    46729402
Copy down the numbers onto your activity sheet. Note that on the activity sheet, the "residual error" is abbreviated as "error".
Use the explanation on your activity sheet about the ANOVA table to answer question 14.