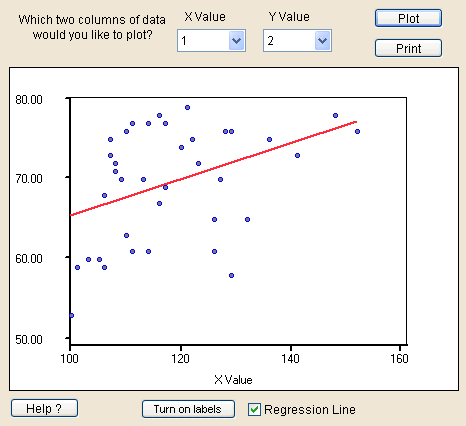
 This
question wants you to generate a scatterplot and try to determine the value
of the correlation coefficient based on the scatterplot alone.
This
question wants you to generate a scatterplot and try to determine the value
of the correlation coefficient based on the scatterplot alone.The worksheet will be provided to you by the instructor in Minitab format and on the website. That is so that you won't know whose blood pressure and pulse rate is whose. Although gender and age may be related to blood pressure and pulse rate, we're not collecting that information for this project. If this were a more clinical study, we would collect and analyze that data and more.
If you're using Statdisk, you may need to type in the information (you might be able to copy and paste from the website).
The variables recorded are called systolic, diastolic, and pulse.
This example uses the predictor variable x = systolic and the response variable y = diastolic but you should use your assigned variables.
Should you wish to duplicate the results in the example, the data is from the Spring 2005 semester of Math 113.
 This
question wants you to generate a scatterplot and try to determine the value
of the correlation coefficient based on the scatterplot alone.
Now make a guess as to what you think the correlation coefficient would be. For my data, there appears to be a very slight positive correlation, but it's not very good at all. I would guess about r = 0.1 (later we'll find out I'm not very close, but this is just a guess).
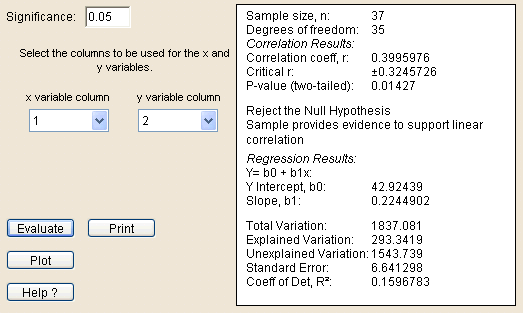
Copy the sample size, mean, standard deviation, and variance onto your activity sheet.
 Correlation and Regression are combined into one screen on Statdisk, so you'll be using these results for several questions.
The top of the output contains the Correlation Results. You need the Correlation coefficient, r, and the p-value.
For question 6, repeat these steps, but switch the x and y variables in step 2.
Switch the x and y back to columns 1 and 2 before you proceed with the rest of this activity. The rest of the questions assume the original order, not the switched order for question 6.
If you are looking at the output used for question 6, be sure to switch the order of the variables back to the proper order before continuing.
Look at the section that is labeled Regression Results
The regression equation is Y = b0 + b1x but DO NOT write that on your paper. Replace the y intercept b0 and the slope b1 by the values given that follow. Replace the y and the x by the names of the variables (x = systolic and y = diastolic in my example)
Don't write: Y = b0 + b1x
Do write: diastolic = 42.92439 + 0.2244902 systolic
Statdisk does NOT give the Analysis of Variance table directly. It does give some of the information from the table, you just have to match things up and calculate some by hand or use Minitab in the first place.
This table will tell you how to find the values in Statdisk and fill them in to the ANOVA table. The labels in the inside of the table correspond to the labels from the Correlation and Regression output shown above from question 5.
| Source | SS (variation) | DF | MS (variance) | F | P |
|---|---|---|---|---|---|
| Regression (explained) | Explained Variation | 1 | see below | see below | see below |
| Residual (unexplained) | Unexplained Variation | Degrees of Freedom (top) | see below | blank | blank |
| Total | Total Variation | Sample size - 1 | see below | blank | blank |
The MS (variance) column is found by dividing the SS (variation) column by the DF column. You'll need to do this by hand, Statdisk doesn't give you the values there (at least not directly). Do this for each row of the table.
There is only one number in the F column, that's in the Regression row. The F test statistic is the MS(Regression) divided by the MS(Residual).
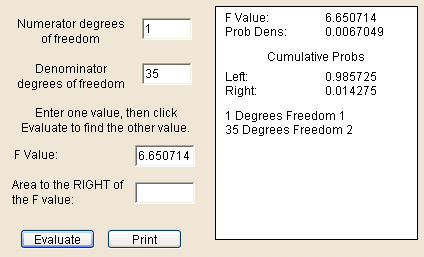
 To find the p-value, which is what the P stands for, using Statdisk you'll need to follow these steps.
The F test is a right tail test, so the cumulative probability to the right of the test statistic F is the p-value.
Taking all the information supplied above, here is what the completed ANOVA table would look like for the data I used to prepare these instructions.
| Source | SS (variation) | DF | MS (variance) | F | P |
|---|---|---|---|---|---|
| Regression (explained) | 293.3419 | 1 | 293.3419 | 6.650714 | 0.014275 |
| Residual (unexplained) | 1543.739 | 35 | 44.10683 | ||
| Total | 1837.081 | 36 | 51.03003 |
Use the explanation on your activity sheet about the ANOVA table to answer questions 10 and 11.