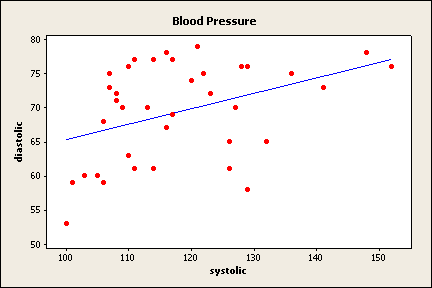
 This
question wants you to generate a scatterplot and try to determine the value
of the correlation coefficient based on the scatterplot alone.
This
question wants you to generate a scatterplot and try to determine the value
of the correlation coefficient based on the scatterplot alone.The worksheet will be provided to you by the instructor. That is so that you won't know whose blood pressure and pulse rate is whose. Although gender and age may be related to blood pressure and pulse rate, we're not collecting that information for this project. If this were a more clinical study, we would collect and analyze that data and more.
The variables recorded are called systolic, diastolic, and pulse.
From now on, when you need to work with the project, open the one for your group.
The following examples use the response variable y = diastolic and the predictor variable x = systolic. Be sure to use your variables when you actually generate the results.
Should you wish to duplicate the results in the example, the data is from the Spring 2005 semester of Math 113.
 This
question wants you to generate a scatterplot and try to determine the value
of the correlation coefficient based on the scatterplot alone.
Now make a guess as to what you think the correlation coefficient would be. For my data, there appears to be a very slight positive correlation, but it's not very good at all. I would guess about r = 0.1 (later we'll find out I'm not very close, but this is just a guess).
I'm going to describe my predictor variable of systolic and my response variable of diastolic. Be sure you use your variables instead of mine.
You should get some output that looks like this.
Variable    N    Mean  StDev  Variance
systolic   37  118.08  12.72    161.69
diastolic  37   69.43   7.14     51.03
Copy the sample size, mean, standard deviation, and variance onto your activity sheet.
I'm going to find the correlation between my variables of systolic and diastolic. Be sure you use your variables instead of mine.
You will get something that looks like this. The first number is the correlation coefficient. The second number is the p-value.
Pearson correlation of systolic and diastolic = 0.400
P-Value = 0.014
Now, repeat these steps, but put the response variable first and the predictor variable second.
I'm going to describe my predictor variable of systolic and my response variable of diastolic. Be sure you use your variables instead of mine
You will get a lot of information and you will probably need to scroll up to find what we need for question 10. The very top of the regression output should contain the regression equation.
The regression equation is
diastolic = 42.9 + 0.224 systolic
There will be an "Analysis of Variance" table that is generated as part of the regression output from question 10. It looks something like this.
Analysis of Variance
Source          DF       SS      MS     F      P
Regression       1   293.34  293.34  6.65  0.014
Residual Error  35  1543.74   44.11
Total           36  1837.08
Copy down the numbers onto your activity sheet. Notice that the order of the columns is switched around on the activity sheet. There is a reason for this that will become evident when we talk more about the ANOVA table. Note that on the activity sheet, the "residual error" is abbreviated as "residual".
The one number that is missing from Minitab is the total MS value. It's not technically part of the ANOVA table, but it does serve a useful purpose.
Use the explanation on your activity sheet about the ANOVA table to answer questions 14-16.