The 2004 Olympic games were held in Athens Greece. On August 20, 2004, the Men's 400m race event was held and the results from those runners who completed the qualifying heats without being disqualified are supplied below.
We will be using the age of the runner to predict the time required to run 400 meters. This makes the response variable "time" and the predictor variable "age".
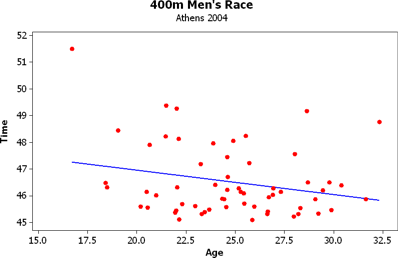
All good data analysis begins with a picture, so let's look at a scatter plot of the data.
Well, the first thing that you notice is that there is an outlier in the data. Abdulla Mohamed Hussein of Somalia was only 16.70 years old and turned in a time of 51.52 seconds. That was more than 2 seconds longer than the nearest competitor's time.
One of the things to consider when looking at data is whether or not to include the values for the outliers. Is it there because it is a legitimate data point or was there some kind of problem with the measurement. Since this was the Olympics, I'm assuming they measured things correctly and so I'm going to leave Abdulla in the data.
The next thing you might notice is that there appears to be a slightly negative slope to the regression line. This might be surprising since you would think that the older people are, the slower they get. But remember that the oldest person there is only 32.32 years old and that's not really that old. Perhaps they are more experienced and have been practicing for longer. Another explanation is that it could be that the outlier is affecting the data.
Here's what the data would look like if we didn't include Abdulla.
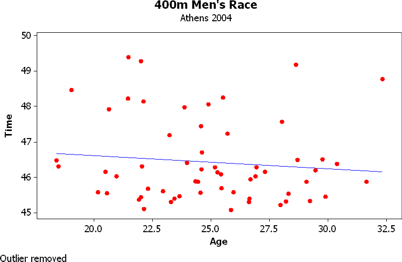
Notice that the slope of the line is not so negative and it almost appears that there is no correlation.
Minitab was used to find the correlation coefficient, which was r = -0.240.
The p-value associated with the hypothesis test is 0.065, which is not significant at a 0.05 level of significance, so there doesn't appear to be any significant linear correlation between the age of the runner and the time required to run 400m.
Since there isn't any significant linear correlation, we shouldn't perform linear regression.
The best estimate for the time required to run 400m in the qualifying heats is the mean of the time. Here are the descriptive statistics from Minitab.
Variable   N    Mean  SE Mean  StDev  Minimum      Q1  Median      Q3  Maximum
Age       60  24.771    0.447  3.459   16.700  22.068  24.600  27.208   32.320
Time      60  46.524    0.171  1.324   45.090  45.563  46.155  47.220   51.520
Since the mean time is 46.524 seconds, the regression equation becomes Time = 46.254.
The regression equation given by Minitab if you perform regression is Time = 48.8 - 0.0917 Age, but as mentioned earlier, that equation shouldn't be used since there isn't significant linear correlation.
The data is sorted by time.
| Time | Age |
|---|---|
| 45.09 | 25.85 |
| 45.11 | 22.14 |
| 45.23 | 27.97 |
| 45.31 | 26.62 |
| 45.31 | 23.29 |
| 45.32 | 28.20 |
| 45.34 | 29.22 |
| 45.37 | 21.93 |
| 45.40 | 23.43 |
| 45.41 | 26.64 |
| 45.44 | 22.00 |
| 45.46 | 29.88 |
| 45.48 | 23.66 |
| 45.54 | 28.30 |
| 45.56 | 20.55 |
| 45.57 | 24.54 |
| 45.59 | 20.18 |
| 45.59 | 25.96 |
| 45.61 | 22.95 |
| 45.69 | 22.30 |
| 45.70 | 25.44 |
| 45.88 | 24.44 |
| 45.88 | 29.07 |
| 45.88 | 31.64 |
| 45.89 | 24.33 |
| 45.95 | 26.69 |
| 46.03 | 20.97 |
| 46.04 | 26.89 |
| 46.09 | 25.43 |
| 46.15 | 25.27 |
| 46.16 | 27.30 |
| 46.16 | 20.49 |
| 46.20 | 29.45 |
| 46.23 | 24.59 |
| 46.28 | 26.93 |
| 46.29 | 25.17 |
| 46.31 | 22.05 |
| 46.32 | 18.49 |
| 46.39 | 30.38 |
| 46.41 | 23.97 |
| 46.48 | 18.40 |
| 46.50 | 28.69 |
| 46.51 | 29.77 |
| 46.70 | 24.61 |
| 47.19 | 23.23 |
| 47.23 | 25.70 |
| 47.45 | 24.58 |
| 47.57 | 28.02 |
| 47.92 | 20.64 |
| 47.98 | 23.86 |
| 48.06 | 24.89 |
| 48.14 | 22.12 |
| 48.23 | 21.46 |
| 48.25 | 25.52 |
| 48.46 | 19.04 |
| 48.77 | 32.32 |
| 49.18 | 28.63 |
| 49.27 | 22.01 |
| 49.39 | 21.47 |
| 51.52 | 16.70 |