The biggest unanswered question from both sections of class was how to tell which portion of the graph to shade.
The "area under the curve" represents the shaded portion and it tells you to the "left" of 1.42, so everything to the left of 1.42 should be shaded.

When the z-score of 1.42 is looked up in the table, the value returned is 0.9222 and since we want the area to the left, we're done.
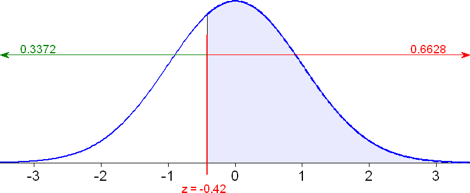
The -0.42 is a single value, therefore it is the z-score looked up in the table and represented by the vertical line. The z is a variable, meaning it can take on many values, and corresponds to the shaded area. So another way of looking at this is "the shaded area is greater than -0.42".

When the z-score of -0.42 is looked up in the table, the area to the left of 0.3372 is returned. However, we want the area to the right, so we need to subtract the area on the left from 1. 1 - 0.3372 = 0.6628, which is the area to the right of -0.42 and the answer to the question.
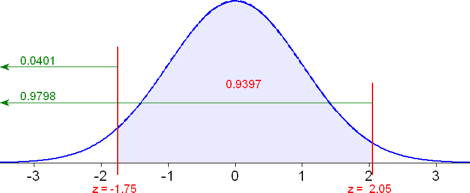
Here there are two z-values, but each of those is a singular number and so they are represented by vertical lines on the graph. The "data" is the shaded portion of the graph and so the shaded portion is between z = -1.75 and z = 2.05.

When you look up the z-scores in the table, you get 0.9798 for the area to the left of z = 2.05 and 0.0401 for the area to the left of z = -1.75. You need the area in between these two values and so you need to subtract the 0.0401 from the 0.9798 to get 0.9397, the area in between those two values.
Since this question specifically asks for the percent, we should convert it by multiplying by 100%, otherwise we would leave it as a decimal. 0.9397 is 93.97%.
This time, you're trying to decide where the shaded portion lies in regards to the z-score.
The key here is to figure out what the antecedent of "it" is. That is, what does "it" refer to? The z-score or the data? Try rewording the sentence and see which makes sense.
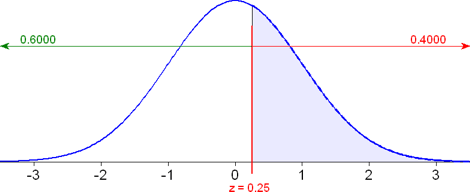
When you reword the sentence, it's obvious that "it" refers to the data because the second sentence just makes no sense. What we have then is a vertical line (z-score) that has 40% of the data greater than that value.
Start shading on the right (greater) and shade until you have 40% of the graph shaded. Since 40% is less than 50%, the entire shaded portion should be on the right side of the graph.

However, you can't look the area to the right in the table, you have to look up the area to the left. The area to the left is found by subtracting the area to the right from 1. So 1 - 0.4000 = 0.6000 and that's what you should look up in the table.
When you do that, the closest value to 0.6000 is 0.5987 and that occurs when z = 0.25. The next closest value is 0.6026, when z = 0.26, but you go with the closest value unless it is exactly half-way between the two values and then you go with the midpoint between the two z-scores.
So, the z-score that has 40% of the data greater than it is z = 0.25.
What we're asking for here is actually called the third quartile, Q3, the value greater than 75% of the data.
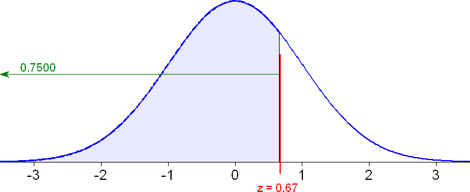
How do I know? In this case the z-score (vertical line) is higher (to the right) of the data (shaded portion). So I'm going to shade 75% of the data and then put the vertical line on the right.
Since 75% is more than 50%, I will shade all of the left side and 25% of the right side.

Since the 75% = 0.7500 is the area to the left, you don't need to adjust it. When you look up 0.7500 in the table, the closest value to it is 0.7486 when z = 0.67. The next closest was 0.7517 when z = 0.68, but it was 0.0017 off and the 0.7486 is only 0.0014 off.
So, the z-score higher than 75% of the data is z = 0.67.