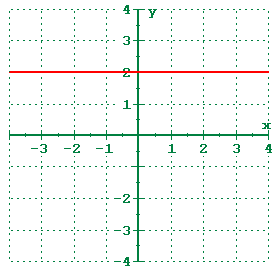
Constant Function
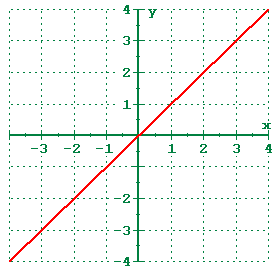
Linear Function
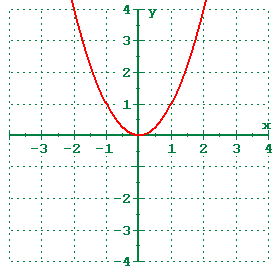
Quadratic Function
Cubic function

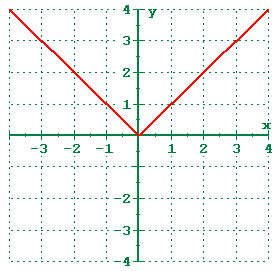
Absolute Value function
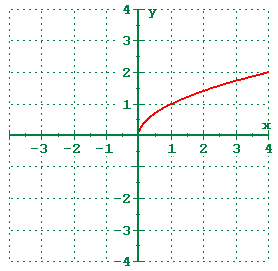
Square Root function
Part of the beauty of mathematics is that almost everything builds upon something else, and if you can understand the foundations, then you can apply new elements to old. It is this ability which makes comprehension of mathematics possible. If you were to memorize every piece of mathematics presented to you without making the connection to other parts, you will 1) become frustrated at math and 2) not really understand math.
There are some basic graphs that we have seen before. By applying translations to these basic graphs, we are able to obtain new graphs that still have all the properties of the old ones. By understanding the basic graphs and the way translations apply to them, we will recognize each new graph as a small variation in an old one, not as a completely different graph that we have never seen before. Understanding these translations will allow us to quickly recognize and sketch a new function without having to resort to plotting points.
These are the common functions you should know the graphs of at this time:
Constant Function
|
Linear Function
|
Quadratic Function
|
Cubic function
|
Absolute Value function
|
Square Root function
|
Your text calls the linear function the identity function and the quadratic function the squaring function.
There are two kinds of translations that we can do to a graph of a function. They are shifting and scaling. There are three if you count reflections, but reflections are just a special case of the second translation.
A shift is a rigid translation in that it does not change the shape or size of the graph of the function. All that a shift will do is change the location of the graph. A vertical shift adds/subtracts a constant to/from every y-coordinate while leaving the x-coordinate unchanged. A horizontal shift adds/subtracts a constant to/from every x-coordinate while leaving the y-coordinate unchanged. Vertical and horizontal shifts can be combined into one expression.
Shifts are added/subtracted to the x or f(x) components. If the constant is grouped with the x, then it is a horizontal shift, otherwise it is a vertical shift.
A scale is a non-rigid translation in that it does alter the shape and size of the graph of the function. A scale will multiply/divide coordinates and this will change the appearance as well as the location. A vertical scaling multiplies/divides every y-coordinate by a constant while leaving the x-coordinate unchanged. A horizontal scaling multiplies/divides every x-coordinate by a constant while leaving the y-coordinate unchanged. The vertical and horizontal scalings can be combined into one expression.
Scaling factors are multiplied/divided by the x or f(x) components. If the constant is grouped with the x, then it is a horizontal scaling, otherwise it is a vertical scaling.
A function can be reflected about an axis by multiplying by negative one. To reflect about the y-axis, multiply every x by -1 to get -x. To reflect about the x-axis, multiply f(x) by -1 to get -f(x).
Consider the basic graph of the function: y = f(x)
All of the translations can be expressed in the form:
y = a * f [ b (x-c) ] + d
| Vertical | Horizontal | |
|---|---|---|
| Scale | a | b |
| Shift | d | c |
| acts normally | acts inversely |
Understanding the concepts here are fundamental to understanding polynomial and rational functions (ch 3) and especially conic sections (ch 8). It will also play a very big roll in Trigonometry (Math 117) and Calculus (Math 121, 122, 221, or 190).
Earlier in the text (section 1.2, problems 61-64), there were a series of problems which wrote the equation of a line as:
x/a + y/b = 1
Where a was the x-intercept and b was the y-intercept of the line. The "a" could really be thought of how far to go in the x-direction (an x-scaling) and the "b" could be thought of as how far to go in the "y" direction (a y-scaling). So the "a" and "b" there are actually multipliers (even though they appear on the bottom). What they are multiplying is the 1 which is on the right side. x+y=1 would have an x-intercept and y-intercept of 1.
Okay. Consider the equation: y = f(x)
This is the most basic graph of the function. But transformations can be applied to it, too. It can be written in the format shown to the below.

In this format, the "a" is a vertical multiplier and the "b" is a horizontal multiplier. We know that "a" affects the y because it is grouped with the y and the "b" affects the x because it is grouped with the x.
The "d" and "c" are vertical and horizontal shifts, respectively. We know that they are shifts because they are subtracted from the variable rather than being divided into the variable, which would make them scales.
In this format, all changes seem to be the opposite of what you would expect. If you have the expression (y-2)/3, it is a vertical shift of 2 to the right (even though it says y minus 2) and it is a vertical stretching by 3 (even though it says y divided by 3). It is important to realize that in this format, when the constants are grouped with the variable they are affecting, the translation is the opposite (inverse) of what most people think it should be.
However, this format is not conducive to sketching with technology, because we like functions to be written as y =, rather than (y-c)/d =. So, if you take the notation above and solve it for y, you get the notation below, which is similar, but not exactly our basic form state above.
y = a * f( (x-c) / b ) + d
Note that to solve for y, you have had to inverse both the "a" and "d" constants. Instead of dividing by "a", you are now multiplying by "a". Well, it used to be that you had to apply the inverse of the constant anyway. When it said "divide by a", you knew that it meant to "multiply each y by a". When it said "subtract d", you knew that you really had to "add d". You have already applied the inverse, so don't do it again! With the constants affecting the y, since they have been moved to the other side, take them at face value. If it says multiply by 2, do it, don't divide by 2.
However, the constants affecting the x have not been changed. They are still the opposite of what you think they should be. And, to make matters worse, the "x divided b" that really means multiply each x-coordinate by "b" has been reversed to be written as "b times x" so that it really means divide each x by "b". The "x minus c" really means add c to each x-coordinate.
So, the final form (for technology) is as above:
y = a * f [ b (x-c) ] + d
Ok, end of digression.
You will notice that the chart says the vertical translations are normal and the horizontal translations are inversed. For an explanation of why, read the digression above. The concepts in there really are fundamental to understanding a lot of graphing.
Any horizontal translation will affect the domain and leave the range unchanged. Any vertical translation will affect the range and the leave the domain unchanged.
Apply the same translation to the domain or range that you apply to the x-coordinates or the y-coordinates. This works because the domain can be written in interval notation as the interval between two x-coordinates. Likewise for the range as the interval between two y-coordinates.
In the following table, remember that domain and range are given in interval notation. If you're not familiar with interval notation, then please check the prerequisite chapter. The first line is the definition statement and should be used to determine the rest of the answers.
| Graph | Translation | Domain | Range |
|---|---|---|---|
| y=f(x) | none | (-2,5) | [4,8] |
| y=f(x-2) | right 2 | (0,7) | [4,8] |
| y=f(x)-2 | down 2 | (-2,5) | [2,6] |
| y=3f(x) | multiply each y by 3 | (-2,5) | [12,24] |
| y=f(3x) | divide each x by 3 | (-2/3,5/3) | [4,8] |
| y=2f(x-3)-5 | multiply each y by 2 and subtract 5;
add 3 to every x |
(1,8) | [3,11] |
| y=-f(x) | reflect about x-axis | (-2,5) | [-8,-4] |
| y=1/f(x) | take the reciprocal of each y | (-2,5) | [1/8,1/4] |
Notice on the last two that the order in the range has changed. This is because in interval notation, the smaller number always comes first.
Understanding the translations can also help when finding the domain and range of a function. Let's say your problem is to find the domain and range of the function y=2-sqrt(x-3).
Begin with what you know. You know the basic function is the sqrt(x) and you know the domain and range of the sqrt(x) are both [0,+infinity). You know this because you know those six common functions on the front cover of your text which are going to be used as building blocks for other functions.
| Function | Translation | Domain | Range | |
|---|---|---|---|---|
| Begin with what you know | y=sqrt(x) | None | [0,+infinity) | [0,+infinity) |
| Apply the translations | y=-sqrt(x) | Reflect about x-axis | [0,+infinity) | (-infinity,0] |
| y=2-sqrt(x) | Add 2 to each ordinate | [0,+infinity) | (-infinity,2] | |
| y=2-sqrt(x-3) | Add 3 to each abscissa | [3,+infinity) | (-infinity,2] |
So, for the function y=2-sqrt(x-3), the domain is x≥3 and the range is y≤2.
And the best part of it is that you understood it! Not only did you understand it, but you were able to do it without graphing it on the calculator.
There is nothing wrong with making a graph to see what's going on, but you should be able to understand what's going on without the graph because we have learned that the graphing calculator doesn't always show exactly what's going on. It is a tool to assist your understanding and comprehension, not a tool to replace it.
It is this cohesiveness of math that I want all of you to "get". It all fits together so beautifully.